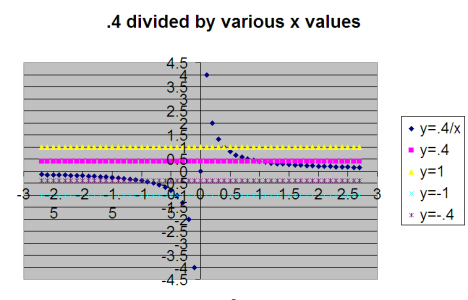
Here’s a graph displaying some of the behavior of division, how division by absolute value of x > 1 results in absolute value y < numerator, and division by absolute value of 0 < x < 1 results in absolute value y > numerator…
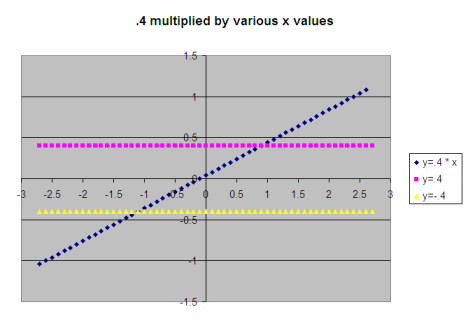
The corresponding graph for multiplication is much simpler…

By the way, I’m a big fan of “quotative division.” As a kid I never thought about it, but there are two ways you can think of division, partative (or “sharing“) and quotative. Say you have 30/2 oranges. Partative would be, say you have two people, how would you split 30 oranges between two people; or if you split 30 oranges into two rows, how many would be in each row? Quotative would be, how many groups of 2 oranges could you split 30 oranges into; if each row had 2 oranges, how many rows would make up a length of 30 oranges?
I like quotative, because I think it’s easier for people to conceptualize division by decimals. If you have 30/.5, partative would be: how would you split up 30 oranges among .5 people; how many oranges would fit in .5 rows? Quotative on the other hand would be, how many rows of .5 oranges would you need to end up with 30 oranges? I think that’s much easier for kids to understand. Quotative is all about splitting the numerator into groups the size of the denominator, which is a bit easier to conceptualize sometimes I think than partative division.
It’s kind of similar with multiplication. 30 * .5 could be make 30 rows with .5 units in each row, or make .5 rows with 30 units in each row. I think the first example 30 rows with .5 units each is easier to conceptualize than .5 rows of 30 units, if you’re a kid, I would think.
Of course, having a good foundation in understanding the what and why of multiplication and division will help kids better understand later topics such as ratios and percentages, and even later topics such as sample spaces in probability and statistics.
From Wikipedia:
“Conceptually, division describes two distinct but related settings. Partitioning involves taking a set of size a and forming b groups that are equal in size. The size of each group formed, c, is the quotient of a and b. Quotative division involves taking a set of size a and forming groups of size b. The number of groups of this size that can be formed, c, is the quotient of a and b[1].”

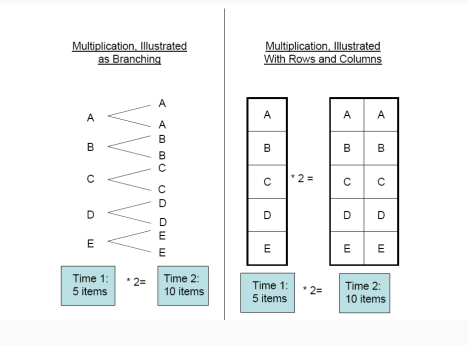
Here’s an image of visualizing multiplication as branching, and as forming rows and columns. Such branching visualization is useful for understanding permutations and combinations in probability and discrete mathematics, such as when you learn about factorials and the binomial theorem.
internal tag: math
Filed under: math | Tagged: children, division, education, graphs, kids, math, multiplication, school | Leave a comment »


